BMA PV Detection — App Index
All pipeline apps running on m5 — local, no online
Live Training Dashboard TRAINING
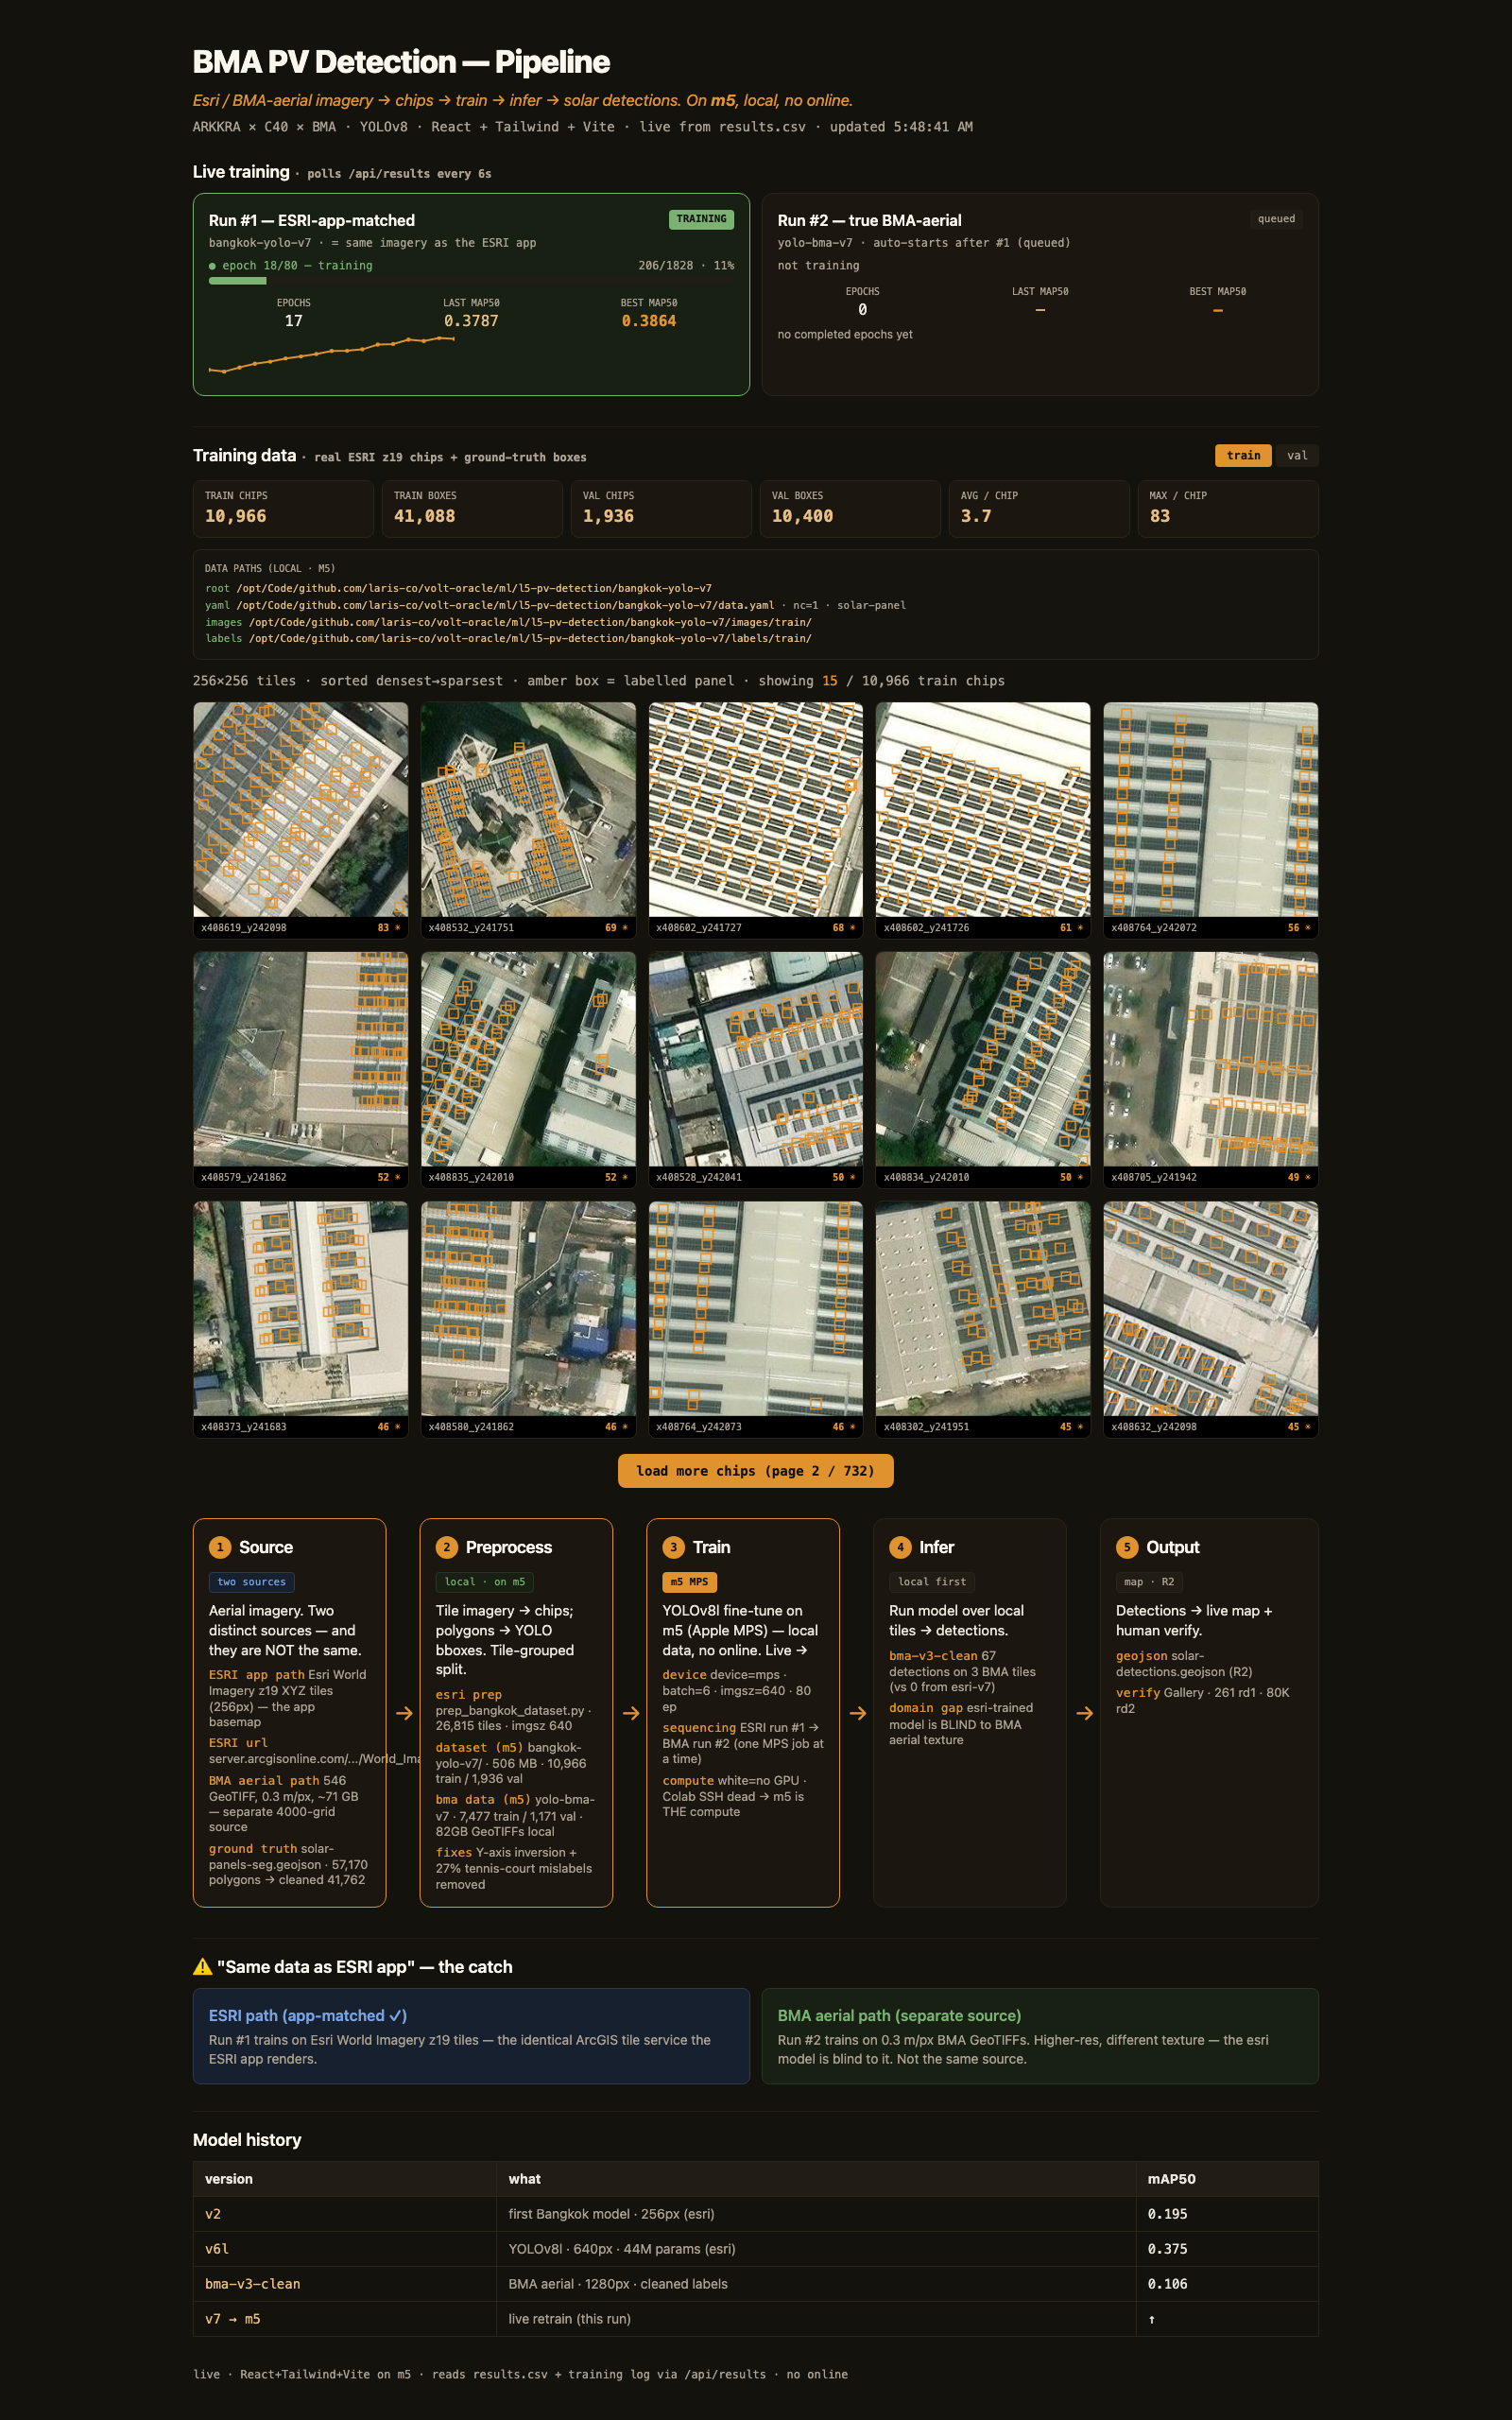
Real-time training monitor — sparkline, epoch/batch progress, training-data gallery with 10,966 chips + ground-truth boxes. Polls results.csv every 6s.
596.9 MW Solar Dashboard BUILT
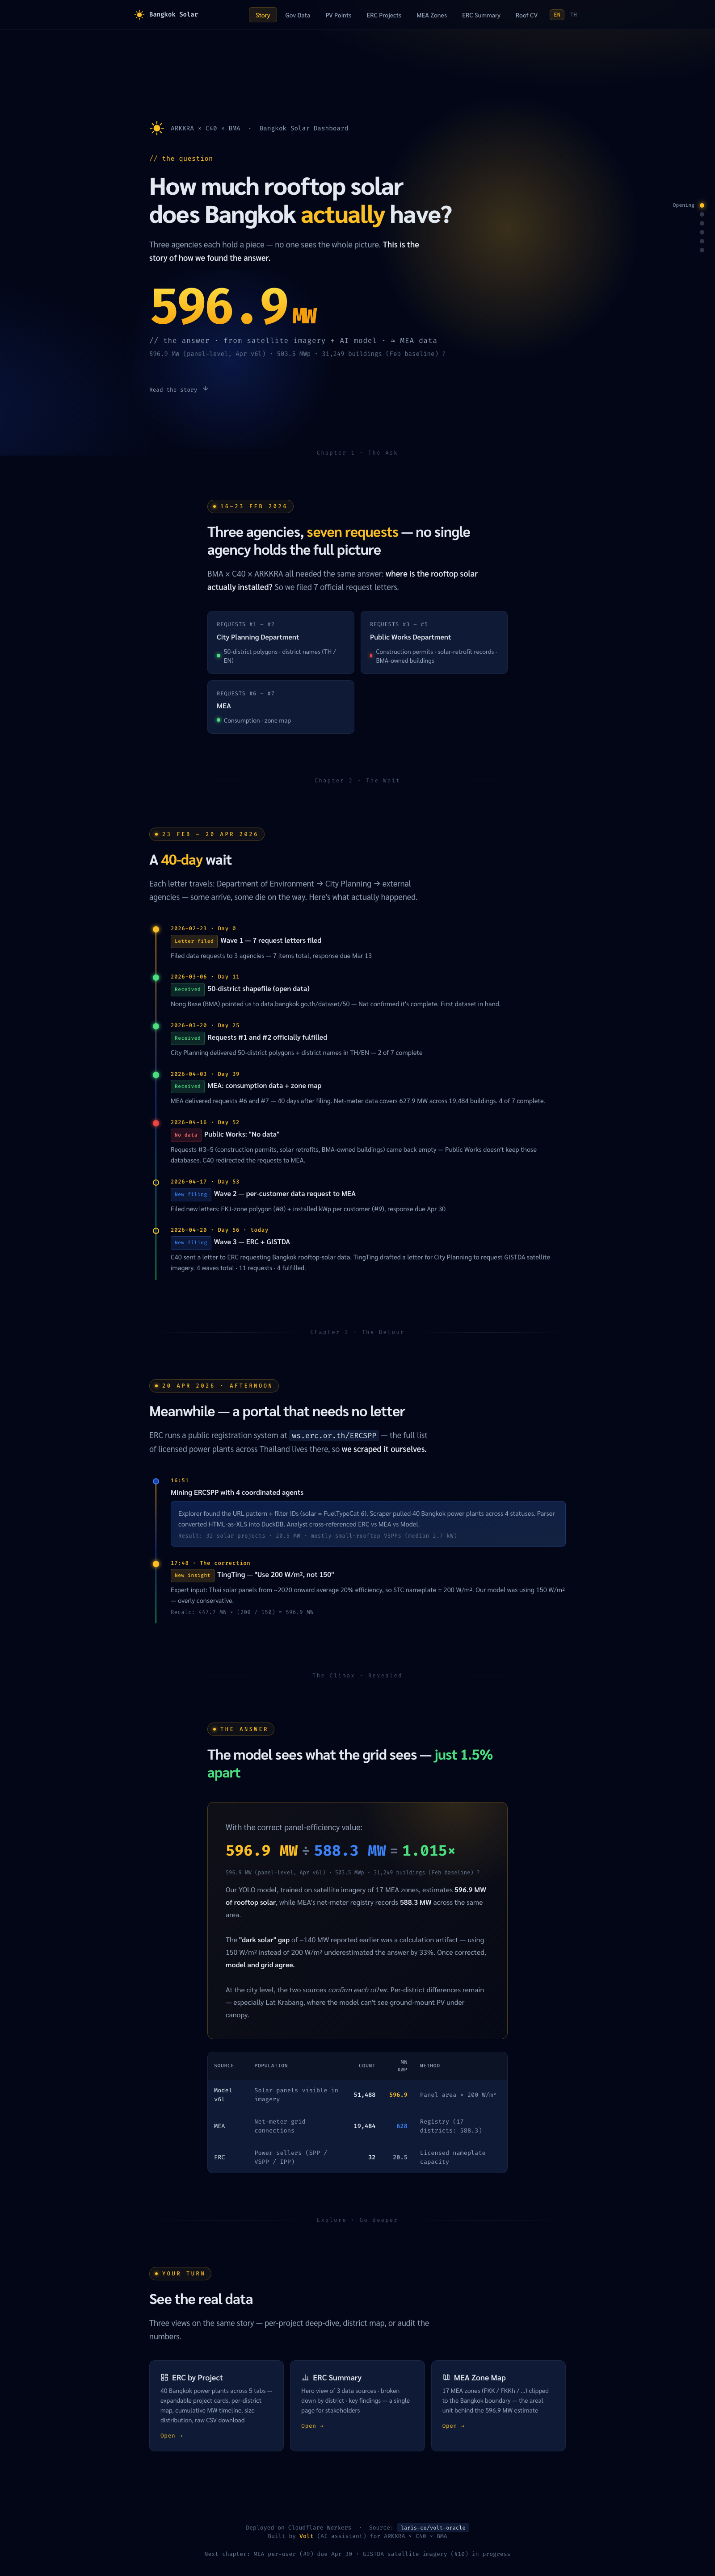
The production deliverable — editorial scrollytelling: "How much rooftop solar does Bangkok actually have?" 596.9 MW, 40-day build log, KPIs, detections map.
L5 Labeling Tool LABELING
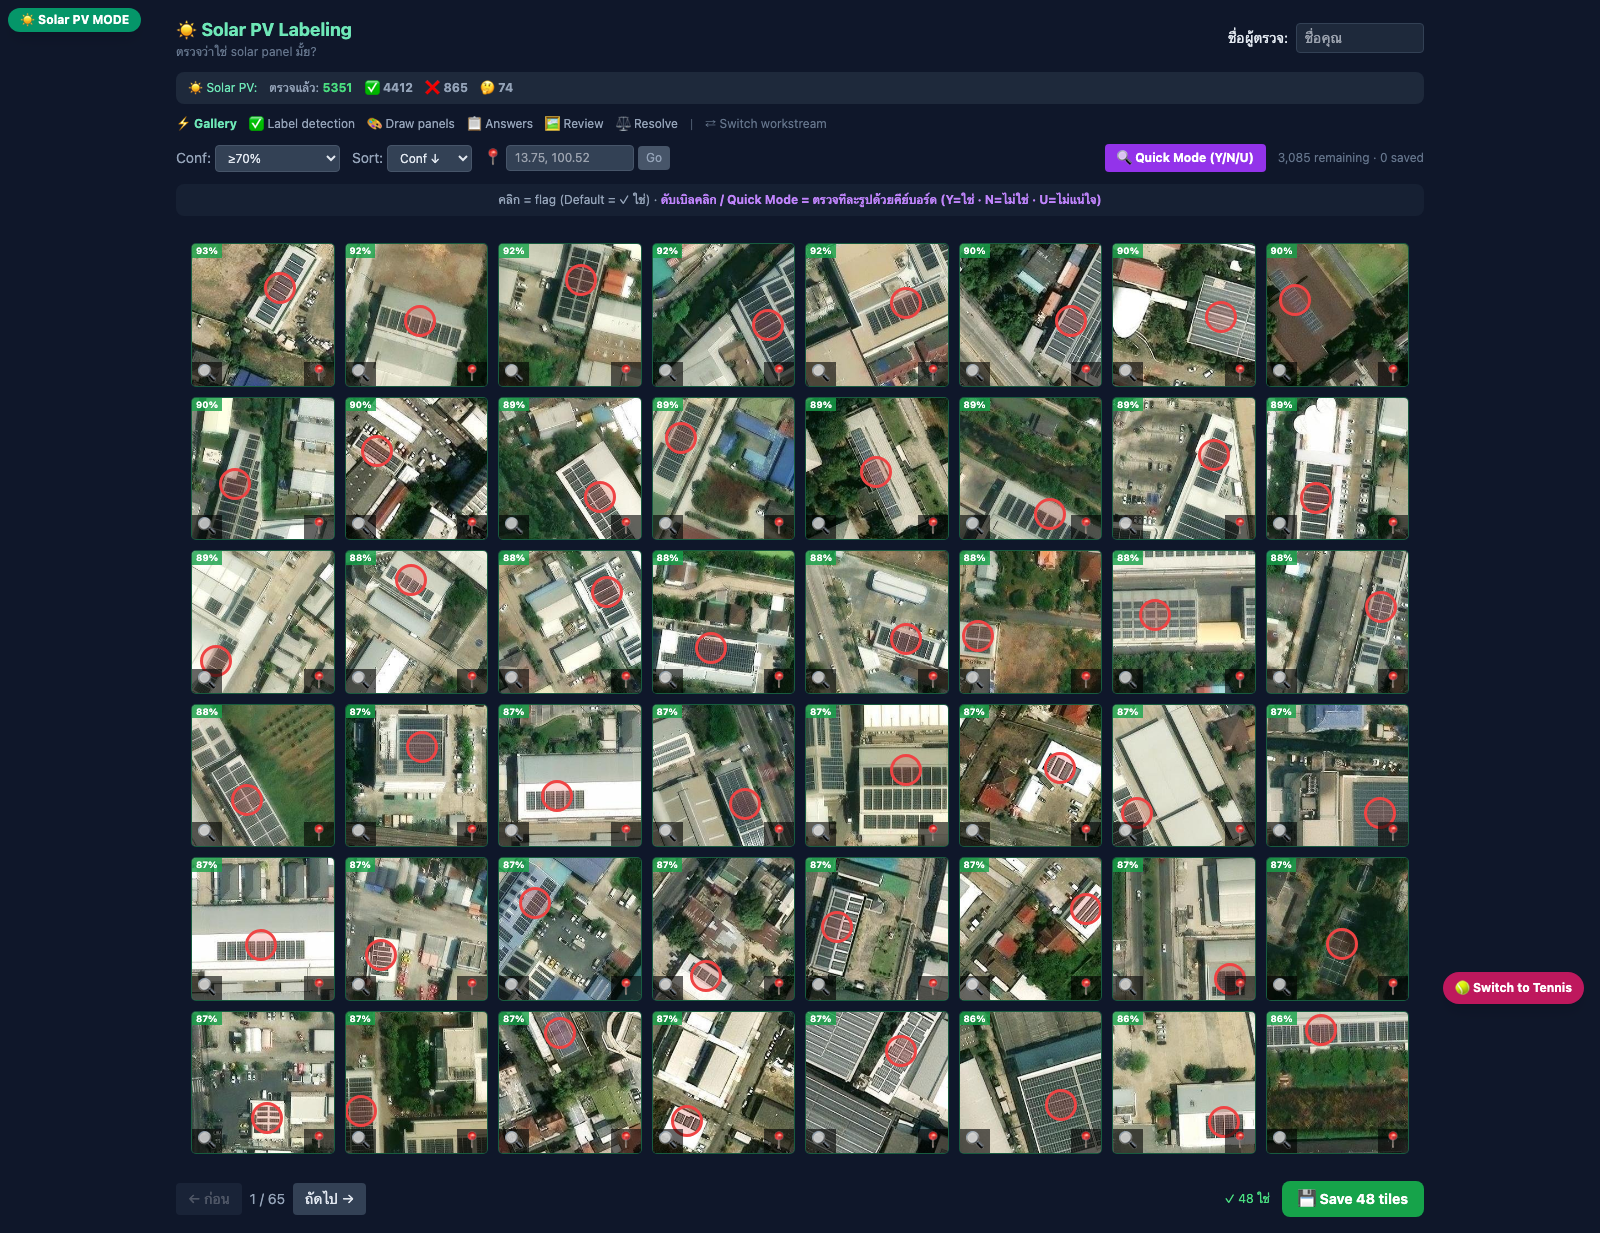
Human-in-the-loop verification — "Is this really a solar panel?" Gallery of 80,000 PV detections + 10,000 tennis-court false positives. 5,351 + 1,156 labels done.
Deliverable v1
First client deliverable — detection viewer + raw layer overlay.
Deliverable v2
Gallery view + map viewer, second iteration.
Open Datasets Viewer
MEA zone map, ERC tariff detail, open-datasets browser. Public-facing data portal.
Flutter macOS App
Native macOS detection viewer — spawned by an agent (Arkkra-Co org).
| Version | What | mAP50 | Used by |
|---|---|---|---|
| v2 | First Bangkok model, 256px | 0.195 | — |
| v6l | YOLOv8l, 640px, 44M params | 0.375 | Solar Dashboard, Top-15, Labeling Tool |
| bma-v3-clean | BMA aerial, 1280px, cleaned labels | 0.106 | — |
| m5-mps-v1 | Live retrain (m5 MPS) — ESRI-matched | 0.386 ↑ | Live Training Dashboard |